Why Community Health Matters
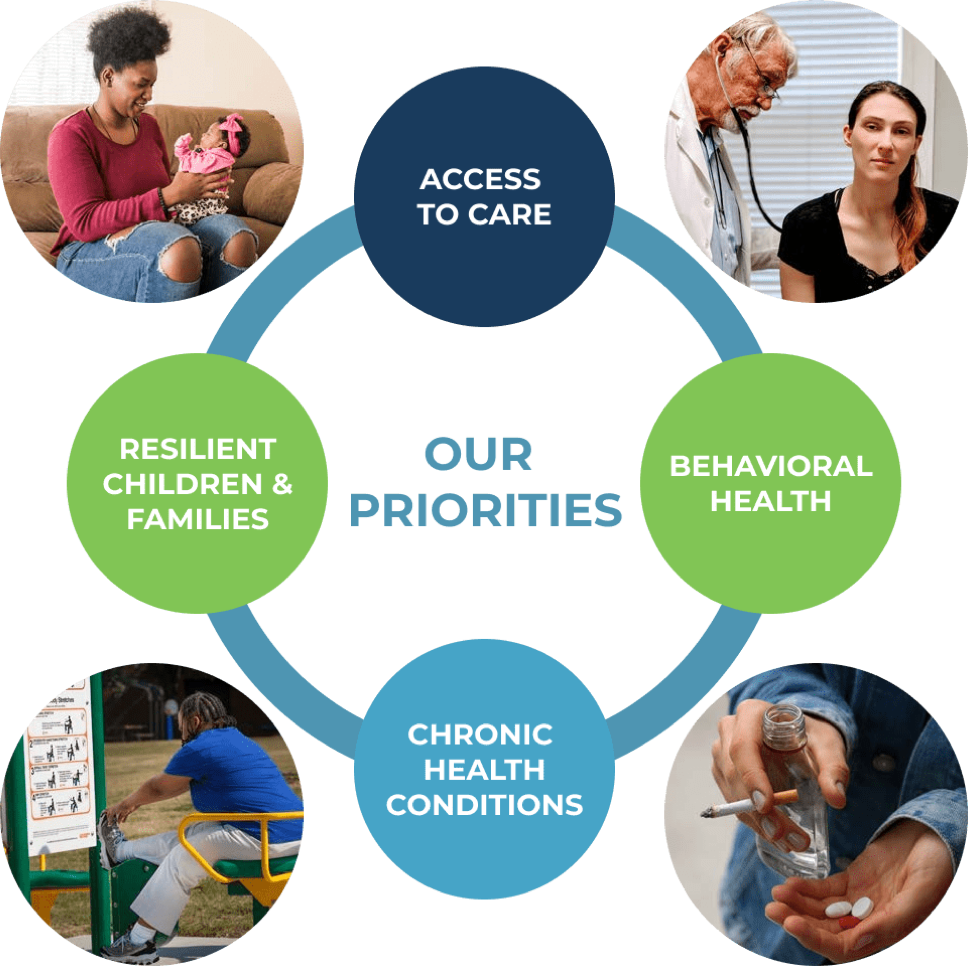
When our neighbors have access to care, support for mental health, and the tools to manage chronic conditions, our whole community grows stronger. The priorities in our plan reflect what we heard from local voices and data, and they are focused on the areas where we can make the biggest difference for today’s families and the next generation.
Access to Care
Everyone deserves access to quality and affordable health care services. Live Healthy Spartanburg believes increasing access and removing barriers to care are essential to improving health outcomes for Spartanburg County residents.
INDICATOR #1
Health Insurance Status
Percentage of adults with health insurance coverage, under the age of 65.
INDICATOR #2
Provider Ratios
Primary Care, OBGYN, Pediatric, Dental, and Mental Health providers per number of residents.
INDICATOR #3
Avoidable Emergency Department Utilization
Rate of avoidable emergency department visits per 100,000 population.
INDICATOR #4
Early & Adequate Prenatal Care
The timing of the first prenatal visit and the number of follow-up visits throughout pregnancy.
What’s our approach?
Following the identification of the Access to Care indicators, our team discussed local strategies that could be led by our community partners. Performance Measures were also identified and will be tracked by those local partners.
Behavioral Health
Access to mental health and substance use services is essential for overall well-being. LHS supports Spartanburg County’s Collective Mental & Behavioral Health Action Plan to strengthen behavioral health resources and ensure every resident can access the supports they need.
PRIORITY #1
Support thriving families and youth by focusing on mental well-being and connections to appropriate supports.
PRIORITY #2
Promote well-being of individuals with serious mental illness, with focus on most vulnerable populations (including unhoused, incarcerated, uninsured, low- income).
PRIORITY #3
Support individuals and families impacted by substance use disorder.
What’s our approach?
Following the identification of the Behavioral Health indicators, our team discussed local strategies that could be led by our community partners. Performance Measures were also identified and will be tracked by those local partners.
Chronic Health Conditions
The places where people live, work, and play shape their ability to lead healthy lives. This includes supporting healthy behaviors and advocating for policy, systems, and environmental changes that make healthy choices easier.
INDICATOR #1
Food Insecurity
Percentage of residents experiencing food insecurity.
INDICATOR #2
Fruit & Vegetable Consumption
Percentage of adults eating less than one serving of fruits and vegetables per day.
INDICATOR #3
Limited Access to Healthy Foods
Percentage of low-income residents living in low-access census tracts.
INDICATOR #4
Adult Physical Inactivity
Percentage of adults reporting no physical activity outside of work.
INDICATOR #5
Access to Opportunities for Physical Activity
Percentage of residents living close to a park or recreation facility.
What’s our approach?
Following the identification of the Chronic Health Conditions indicators, our team discussed local strategies that could be led by our community partners. Performance Measures were also identified and will be tracked by those local partners.
Resilient Children & Families
Resiliency is possible when there is access to support, resources, and environments that allow children and families to be healthy, safe, and prepared for lifelong success.
INDICATOR #1
Kindergarten Readiness
Percentage of students demonstrating readiness to learn using the Early Development Instrument.
INDICATOR #2
Abuse & Neglect
Number of children referred for investigation of maltreatment for abandonment, including all types of abuse & neglect.
INDICATOR #3
Third Grade Literacy
Percentage of third graders testing below standards in English/Language Arts.
INDICATOR #4
Asset Limited, Income Constrained (ALICE)
Percentage of households that earn more than the Federal Poverty Level, but less than the basic cost of living.
INDICATOR #5
Adverse Childhood Experiences (ACES)
Percentage of adults that self-report childhood ACES.
What’s our approach?
Following the identification of the Resilient Children & Families indicators, our team discussed local strategies that could be led by our community partners. Performance Measures were also identified and will be tracked by those local partners.
Learn More About Our Resilient Children & Families Strategies
Have questions about the improvement areas?
Both our Community Health Improvement Plan and Community Health Needs Assessment are available for everyone to read. If you have more questions, reach out to us to learn more.